

Insight

We are no longer in a valuation-driven market cycle. We are operating in a flow-driven, behaviourally amplified regime where: speculative capital initiates price moves, institutional capital crowds those moves, and systematic strategies structurally reinforce them.
This has created:
In this environment, portfolio outcomes are being determined less by what you buy and more by how you behave. Patience, liquidity, entry discipline, and diversification across return drivers now matter more than prediction.
To understand today’s market, you must start with behaviour — not macro. The current cycle is being driven by three sequential forces:
Speculate first. Analyse later.
What it means: High-risk, short-term capital deployed with little or no valuation discipline.
In market terms: Typically expressed through weekly options, highly thematic equities, concentrated positions, and leverage with a time horizon measured in days, not years.
Behavioural driver: The pursuit of maximum upside with minimal patience.
The real-world version: “This stock is going up. I’m buying calls. I’ll figure out the fundamentals later.”
Why it matters: YOLO flows are not the largest pools of capital, but they are the fastest and most aggressive, and they are what start sharp price moves.
Buy because everyone else already did.
What it means: Investors are buying assets not because they are cheap, but because they are outperforming.
In market terms: Institutional capital reallocating due to benchmark concentration, relative performance pressure, and career risk.
Behavioural driver: The fear of underperforming more than the fear of losing money.
The real-world version: “We said it was overvalued 30% ago. But we can’t afford not to own it.”
Why it matters: FOMO turns leadership into a crowded consensus trade, reducing true diversification and increasing downside risk when trends reverse.
The trend becomes the allocation model.
What it means: Systematic and passive strategies buying assets because their prices are rising.
In market terms: Capital is allocated based on index weight increases, trend-following models, volatility targeting and options hedging flows.
Machine logic: Price up → weight up → forced buying
The real-world version: “The model doesn’t care about valuation. The trend is the signal.”
Why it matters: At this stage, price movements become self-reinforcing and structural, no longer dependent on fundamentals.
YOLO starts the move → FOMO crowds the trade → MOMO hard-codes the trend.
This explains why markets today can:
Because flows, not fundamentals, are setting the price.
Over the past two decades, passive and systematic strategies have moved from marginal participants to dominant price setters.
This represents a structural transformation in market microstructure. Fundamentals still determine long-term value, but they no longer determine short-term price.
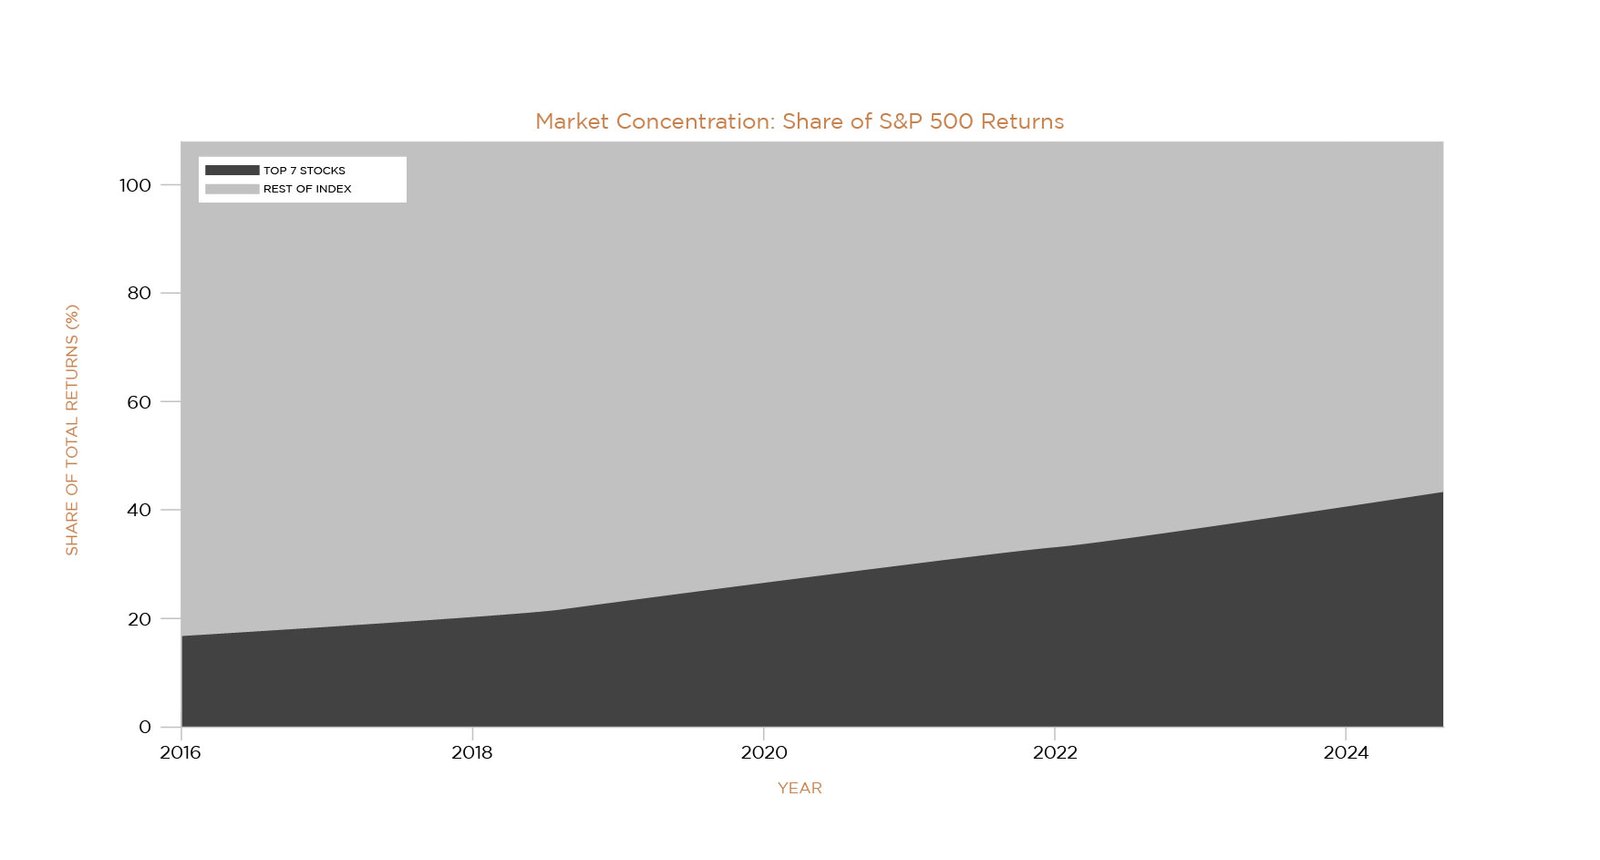
A narrow group of mega-cap stocks now dominates index performance:
Meanwhile, only 48–62% of stocks remain above their 200-day moving average and correlations spike during stress periods. Many portfolios that appear diversified are, in reality, a single crowded momentum position.
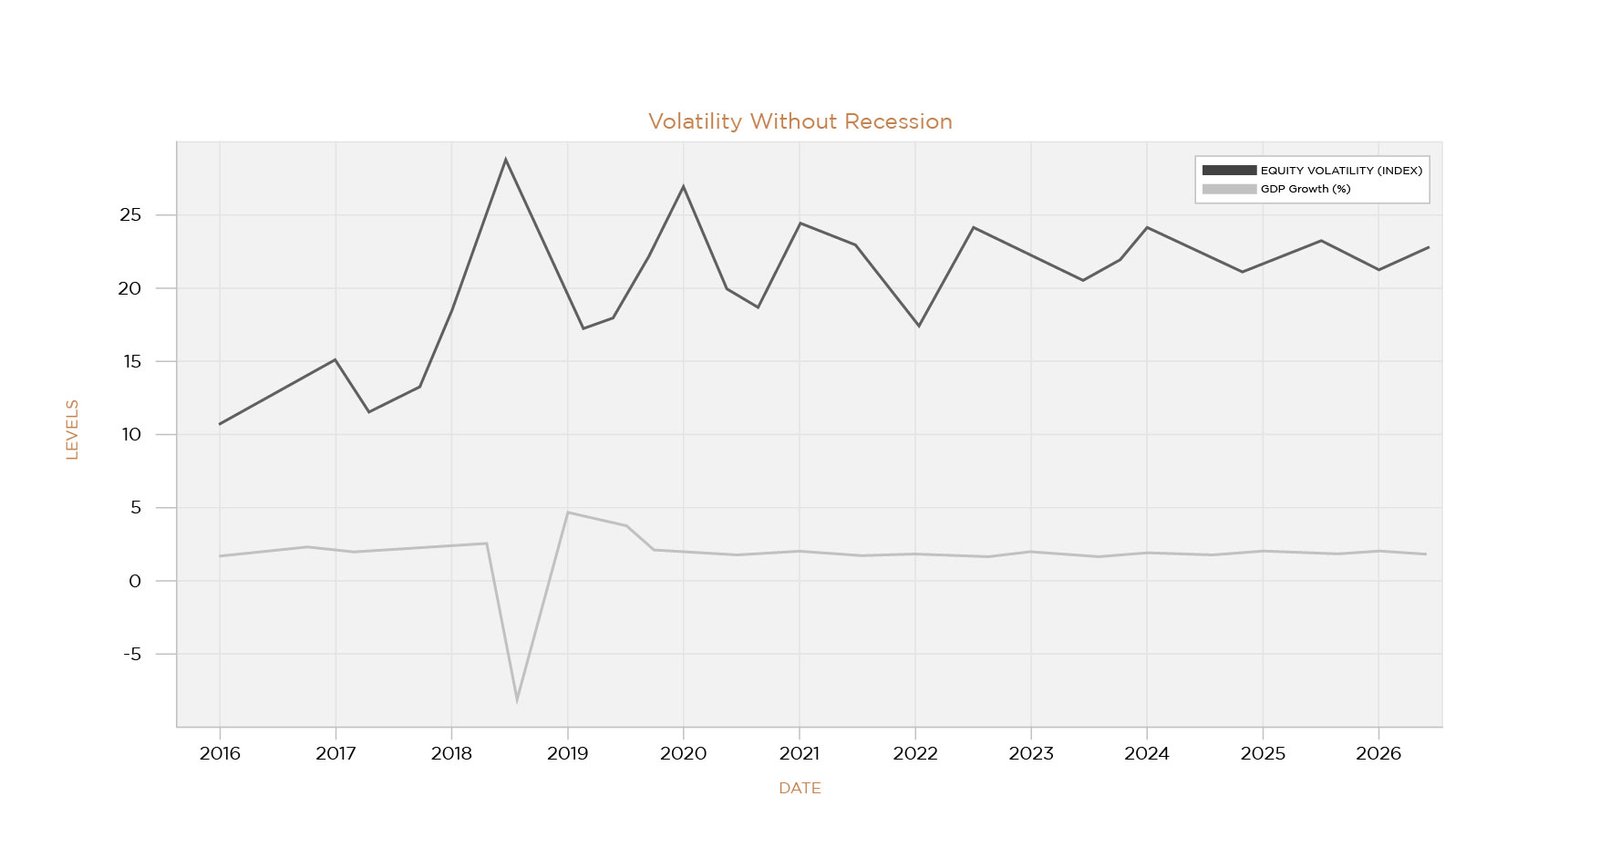
In 2025, VIX remained above 20 for more than 40% of the year and realised volatility averaged 18–22%, well above pre-2019 norm.
This occurred despite stable economic growth, positive earnings revisions, and multiple policy pivot expectations.
Volatility is now driven by positioning, liquidity and flow reversals—not recessions.
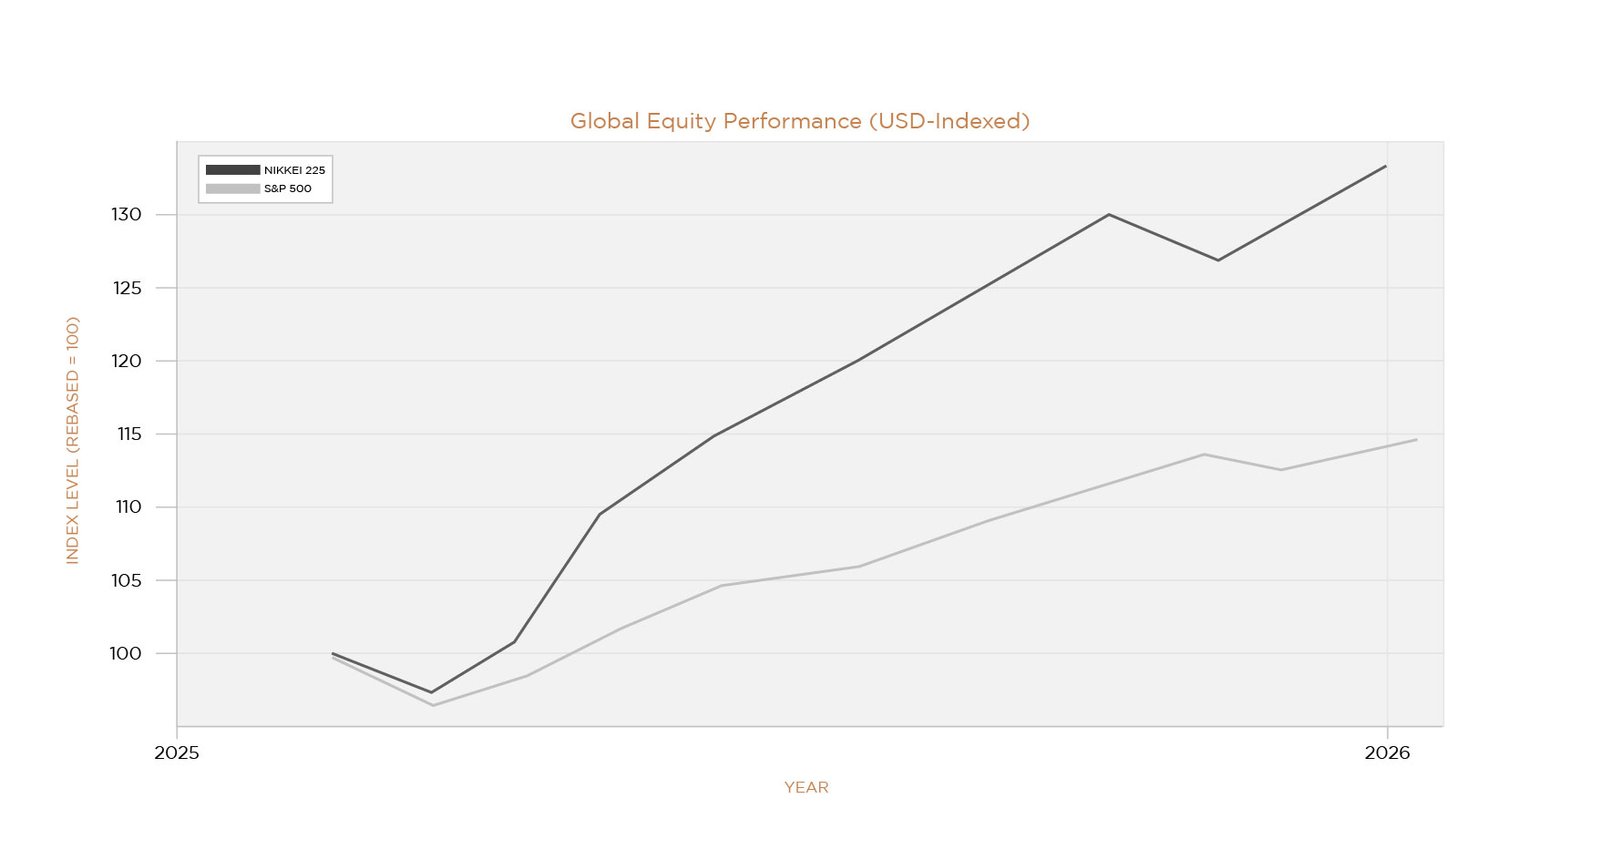
The U.S. represents approximately 25% of the global GDP and 60% of the global equity market capitalisation. The rest of the world? About 75% of the global output and roughly 38% of global market weight.
This imbalance is valuation driven, currency sensitive and mean-reversion prone.
Global diversification is no longer tactical. It is structural risk management.
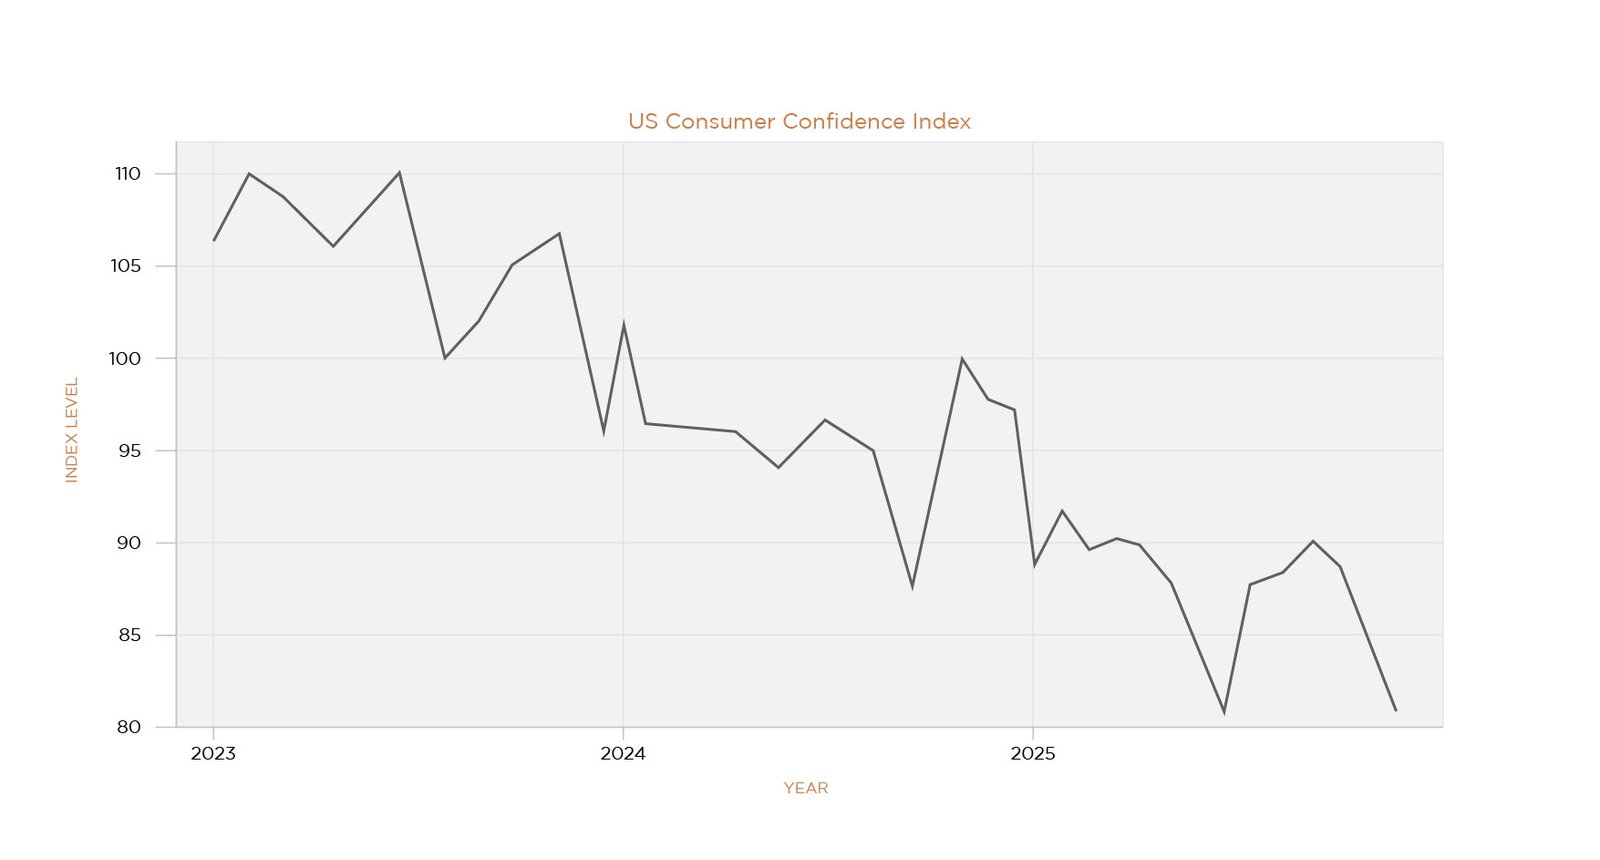
Economic growth remains stable, but the distribution of that growth is uneven: consumer confidence is at near decade lows, high-income households are driving discretionary spending, and lower-income cohorts are facing real income pressure.
Markets are being supported by liquidity and asset inflation, not broad economic strength.
If price action is being driven primarily by behaviour and flows, then portfolio strategy must be built around emotional control, liquidity management and disciplined entry points, not constant activity.
The greatest risk in volatile markets is being overexposed and emotionally reactive.
Balanced exposure allows investors to:
In momentum-driven markets: buying strength feels safe, but increases risk.
For long-term investors:
reduces behavioural mistakes and improves long-term outcomes.
Cash is not underperformance in this regime.
Cash provides:
Periods of stress reward the liquid. They punish the fully invested.
True diversification is not owning more stocks.
It is combining different:
For professional traders, volatility creates opportunity. For long-term investors, attempting to trade momentum cycles typically leads to:
Disciplined accumulation during weakness — not participation in euphoria — remains the more effective approach.
We are in a market where behaviour is amplifying both upside and downside. Understanding the YOLO → FOMO → MOMO cycle explains the price action. Controlling our own behaviour is what protects and compounds capital.
In this regime, the objective is not to chase returns. It is to stay disciplined, avoid emotional decisions, preserve flexibility, and deploy capital only when the probability is in your favour.
Commentary by Warren Poon at AIX Investment Group
Disclaimer: The above market analysis/information is recreated for information and knowledge purposes only under personal capacity, however it does not constitute any liability or obligation upon the readers or the firm to take investment decisions.